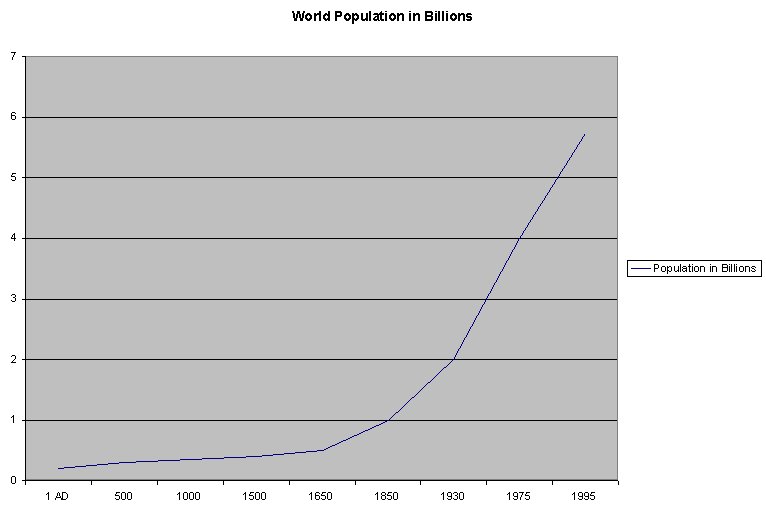
Use the chart to create a spreadsheet which shows world population growth between 1AD and 1995. Create a line graph that looks the one above.